Table of Contents
- What are Crypto Charts?
- Types of Crypto Trading Charts
- How to Read a Cryptocurrency Chart
- How to Read Crypto Candlestick Patterns
- Common Patterns in Crypto Charts
- Trend Lines and Crypto Trend Patterns
- Technical Indicators for Crypto Graph Analysis
- To Recap
- FAQs
If you want to make smart decisions in crypto trading, you need to know how to read crypto charts. Just like a weather forecast helps you plan for rain or sunshine, crypto trading charts help traders predict possible price movements.
Whether you’re a beginner or an experienced trader, understanding cryptocurrency graph analysis is essential for spotting trends, recognising opportunities, and avoiding losses.
In this guide, we will break down how to read cryptocurrency charts, explain common crypto trend patterns, and provide practical tips for using cryptocurrency technical charts like a pro.
By the end, you’ll know how to use a live cryptocurrency chart to track cryptocurrency prices and charts, identify patterns, and make confident trading decisions.
What are Crypto Charts?
When you hear about cryptocurrency prices going up or down, what does that really mean?
Crypto charts are the tools that traders and investors use to understand these price movements.
Simply put, a crypto chart is a visual representation of how a cryptocurrency’s price has changed over time. These charts show key details like past prices, trading volume, and market trends.
A crypto trading chart is like a map that helps you navigate the unpredictable world of crypto trading.
If you want to learn to read crypto charts, you need to understand the different elements displayed on them, such as candlesticks, trend lines, and trading volumes.
These elements reveal important patterns in cryptocurrency market movements, like whether prices are trending upward (bullish) or downward (bearish).
Types of Crypto Trading Charts
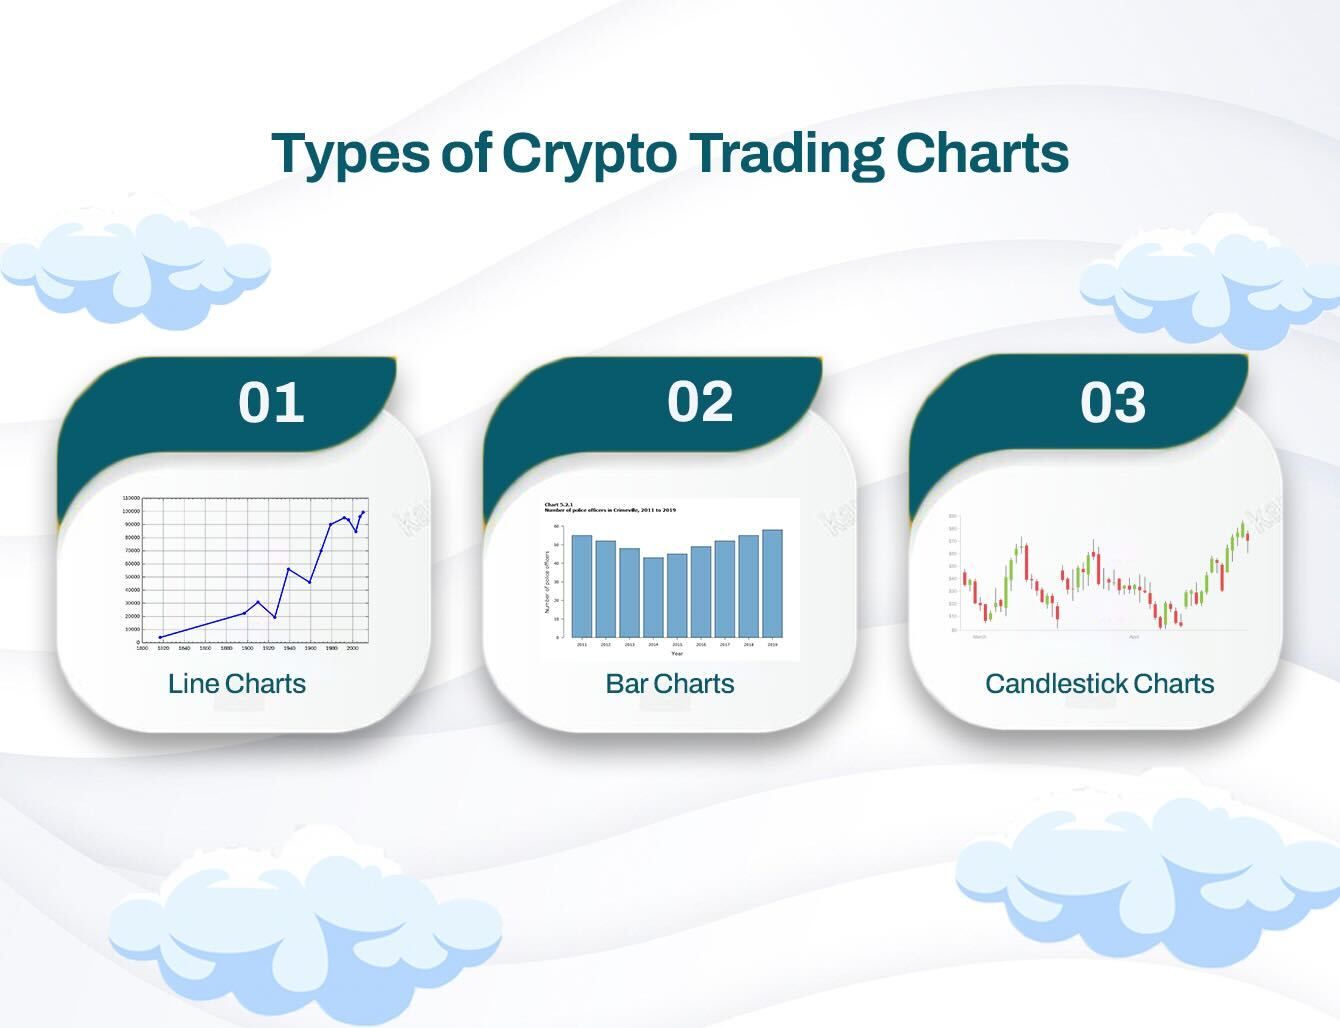
1. Line Charts:
A line chart is the simplest type of cryptocurrency trading chart. It represents the closing prices of a cryptocurrency over a specific period by connecting data points with a single continuous line.
This type of chart is ideal for beginners who want a quick overview of market trends without being overwhelmed by too much information.
Line charts are helpful for identifying the overall direction of a cryptocurrency’s price, whether it is trending upward, downward, or staying relatively stable.
However, they do not show detailed price movements within a given timeframe, such as opening prices or price fluctuations during the trading period.
Many traders use line charts as a starting point before moving on to more detailed chart types for deeper cryptocurrency graph analysis.
2. Bar Charts:
A bar chart provides a more detailed view of price movements compared to a line chart.
Each bar represents price information for a specific period, including the opening price, highest price, lowest price, and closing price (often referred to as OHLC data).
The top of the bar indicates the highest price reached during that period, while the bottom represents the lowest price.
A horizontal line on the left side of the bar shows the opening price, and a horizontal line on the right side marks the closing price.
This type of chart is particularly useful for understanding cryptocurrency market movements and price volatility.
Bar charts help traders spot patterns in crypto charts, such as trends, reversals, and price consolidation areas.
3. Candlestick Charts:
Candlestick charts are the most popular type of cryptocurrency trading charts among traders.
They provide the same OHLC (Open-High-Low-Close) data as bar charts but in a more visual and intuitive way.
Each candlestick consists of a body and wicks (also called shadows). The body represents the opening and closing prices, while the wicks show the highest and lowest prices reached within the specific timeframe.
If the closing price is higher than the opening price, the candlestick is typically coloured green or white, indicating a price increase.
If the closing price is lower than the opening price, the candlestick is red or black, signalling a price drop.
Candlestick charts are widely used for identifying patterns in crypto charts, such as bullish and bearish trends, reversals, and continuation patterns.
Traders often rely on candlestick patterns, such as the Doji, Hammer, and Engulfing patterns, to predict future price movements and make strategic trading decisions.
How to Read a Cryptocurrency Chart
Here are the key elements to focus on when reading a cryptocurrency trading chart:
1. Timeframes:
Cryptocurrency charts can be set to different timeframes, ranging from one minute to one month or more.
The chosen timeframe determines how much data is displayed and how trends appear.
For short-term traders (day traders or scalpers), smaller timeframes like 1-minute, 5-minute, or 15-minute charts are helpful.
Long-term investors typically analyse daily, weekly, or monthly charts to identify broader trends.
The timeframe you choose should align with your trading strategy.
2. Price Movements:
The core of any cryptocurrency market movement is price action.
Crypto trading charts display the historical prices of an asset over time, showing how its value fluctuates.
The most common type of price representation is the candlestick chart, where each candle represents the opening, closing, high, and low prices within a given period. Green candles indicate price increases, while red candles show price declines.
Recognising these patterns helps traders predict future movements and make better investment decisions.
3. Volume:
Volume is a critical factor in cryptocurrency graph analysis. It shows the number of trades executed within a specific period.
High volume during a price increase usually confirms a strong uptrend, while high volume during a price drop signals strong selling pressure.
Low trading volume can indicate weak market interest, which may result in unpredictable price swings.
Monitoring volume helps traders understand the strength of a trend before making a trade.
4. Support and Resistance Levels:
Support and resistance are essential concepts in crypto trend patterns.
Support refers to a price level where an asset tends to stop falling and bounce back up due to strong buying interest.
Resistance is the opposite—it is a price level where an asset struggles to rise further due to increased selling pressure.
Identifying these levels can help traders decide when to enter or exit trades.
A breakout above resistance may indicate a buying opportunity, while a drop below support could signal a selling point.
5. Trend Lines:
Trend lines are a fundamental part of chart analysis in crypto.
They help traders visualise the direction of the market—whether it is moving upward (bullish trend), downward (bearish trend), or sideways (consolidation).
Drawing trend lines involves connecting price highs and lows to identify potential breakout points.
Recognising crypto patterns through trend lines allows traders to anticipate market movements and adjust their strategies accordingly.
6. Candlestick Patterns:
Understanding how to read candlesticks in crypto trading is crucial for predicting market behaviour. Some common candlestick patterns include:
- Bullish Patterns: Hammer, Morning Star, and Engulfing Candles indicate potential upward price reversals.
- Bearish Patterns: Shooting Star, Evening Star, and Bearish Engulfing Candles signal possible downward trends.
- Neutral Patterns: Doji candles suggest market indecision, meaning traders should wait for confirmation before taking action. Recognising these patterns in crypto charts can improve trading accuracy and decision-making.
7. Moving Averages:
Moving averages help smooth out price data and identify trends in cryptocurrency technical charts. There are two main types:
- Simple Moving Average (SMA): Calculates the average price over a set period (e.g., 50-day SMA, 200-day SMA).
- Exponential Moving Average (EMA): Gives more weight to recent prices, making it more responsive to market changes. Crossovers between short-term and long-term moving averages often indicate buying or selling opportunities.
8. Relative Strength Index (RSI):
RSI is a momentum indicator that measures whether a cryptocurrency is overbought or oversold. It ranges from 0 to 100:
- Above 70: Indicates overbought conditions (potential price drop).
- Below 30: Suggests oversold conditions (potential price increase). Using RSI in cryptocurrency graph analysis helps traders avoid buying at peaks and selling at lows.
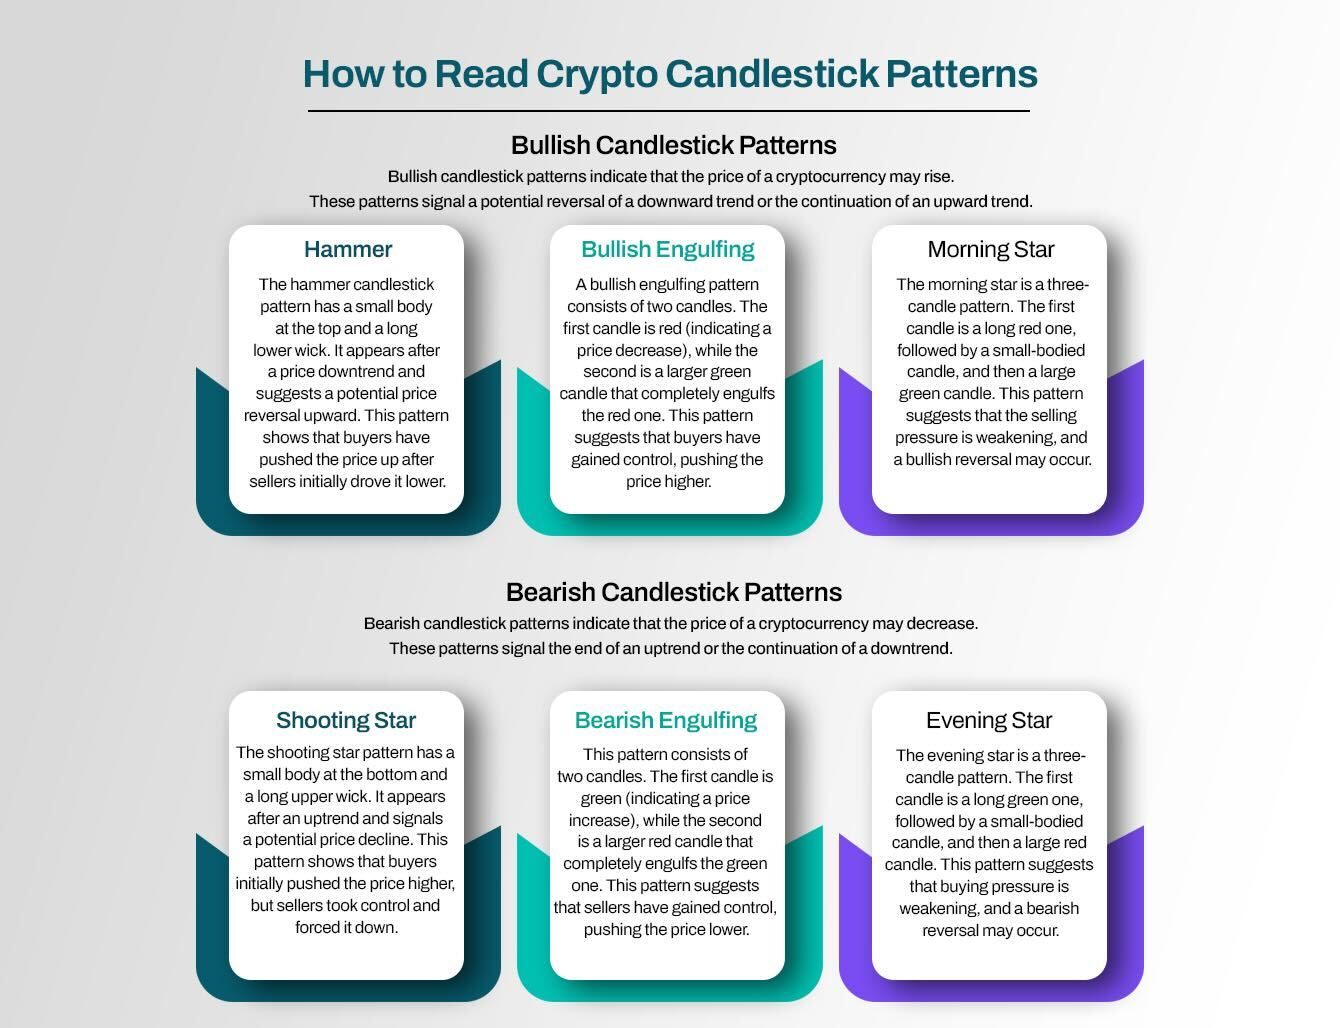
How to Read Crypto Candlestick Patterns
Candlestick patterns fall into two main categories:
1. Bullish Candlestick Patterns:
Bullish candlestick patterns indicate that the price of a cryptocurrency may rise.
These patterns signal a potential reversal of a downward trend or the continuation of an upward trend.
Here are the most common bullish patterns:
- Hammer: The hammer candlestick pattern has a small body at the top and a long lower wick. It appears after a price downtrend and suggests a potential price reversal upward. This pattern shows that buyers have pushed the price up after sellers initially drove it lower.
- Bullish Engulfing: A bullish engulfing pattern consists of two candles. The first candle is red (indicating a price decrease), while the second is a larger green candle that completely engulfs the red one. This pattern suggests that buyers have gained control, pushing the price higher.
- Morning Star: The morning star is a three-candle pattern. The first candle is a long red one, followed by a small-bodied candle, and then a large green candle. This pattern suggests that the selling pressure is weakening, and a bullish reversal may occur.
2. Bearish Candlestick Patterns:
Bearish candlestick patterns indicate that the price of a cryptocurrency may decrease.
These patterns signal the end of an uptrend or the continuation of a downtrend.
Here are the most common bearish patterns:
- Shooting Star: The shooting star pattern has a small body at the bottom and a long upper wick. It appears after an uptrend and signals a potential price decline. This pattern shows that buyers initially pushed the price higher, but sellers took control and forced it down.
- Bearish Engulfing: This pattern consists of two candles. The first candle is green (indicating a price increase), while the second is a larger red candle that completely engulfs the green one. This pattern suggests that sellers have gained control, pushing the price lower.
- Evening Star: The evening star is a three-candle pattern. The first candle is a long green one, followed by a small-bodied candle, and then a large red candle. This pattern suggests that buying pressure is weakening, and a bearish reversal may occur.
Practical Tips for Reading Crypto Candlestick Patterns
- Check the Volume: A pattern is more reliable when trading volume is high. Higher volume means stronger buying or selling pressure.
- Use Time Frames Wisely: Candlestick patterns work best when viewed in the right time frame. Shorter time frames (e.g., 5-minute charts) are useful for short-term traders, while longer time frames (e.g., daily charts) are better for long-term traders.
- Confirm with Other Indicators: Relying solely on candlestick patterns can be risky. Use other technical indicators, such as moving averages and Relative Strength Index (RSI), to confirm trends.
- Practice on a Cryptocurrency Chart Live: Observing live cryptocurrency charts will help you identify patterns faster and improve your ability to predict cryptocurrency market movements.
Common Patterns in Crypto Charts
Here are some of the most common patterns in crypto charts:
1. Head and Shoulders:
The Head and Shoulders pattern is a strong indicator of a reversal in the current trend.
It appears when a cryptocurrency’s price forms three peaks: the middle peak (the “head”) is the highest, while the two side peaks (the “shoulders”) are lower but nearly equal in height.
- Formation: A price rally leads to the first peak (left shoulder), followed by a higher peak (head), and then a third peak (right shoulder), which is about the same level as the first.
- Meaning: If this pattern forms after an uptrend, it suggests that the price may soon decline (bearish reversal). If the pattern is inverted (upside down), it signals a potential price increase (bullish reversal).
- Confirmation: Traders usually wait for the price to break below the "neckline" (the support level connecting the two shoulders) before making a move.
2. Wedges:
A Wedge pattern shows a period of price consolidation before a breakout occurs. There are two types:
- Rising Wedge (Bearish): Price forms higher highs and higher lows, but the trend line narrows. This usually signals an upcoming price drop.
- Falling Wedge (Bullish): Price forms lower highs and lower lows, but the trend line narrows. This often indicates an upcoming price increase.
- Confirmation: A breakout happens when the price moves sharply in one direction after breaking out of the wedge.
3. Double Top and Double Bottom:
These patterns indicate a reversal at key support or resistance levels.
- Double Top (Bearish Reversal): Occurs when the price reaches a peak, drops, rises again to the same peak level, and then falls again. This signals strong resistance and a potential downward trend.
- Double Bottom (Bullish Reversal): Happens when the price falls to a low, rebounds, falls again to the same level, and then rises. This suggests strong support and an upward trend ahead.
- Confirmation: Traders wait for the price to break above the resistance (for double bottom) or below the support (for double top) before taking action.
4. Support and Resistance Levels:
Understanding Support and Resistance is important in crypto trading chart analysis.
- Support: A price level where a cryptocurrency tends to stop falling because buyers step in.
- Resistance: A price level where a cryptocurrency struggles to rise because sellers take control.
- Usage: Traders often buy near support levels and sell near resistance levels, using these points to predict future movements.
5. Triangle:
Triangles form when the price consolidates between two converging trend lines. There are three types:
- Ascending Triangle (Bullish): A horizontal resistance line forms at the top while the lows rise, indicating that the price might break upwards.
- Descending Triangle (Bearish): A horizontal support line forms at the bottom while the highs drop, suggesting a potential downward breakout.
- Symmetrical Triangle (Neutral): The trend lines converge without a clear bias, meaning the price could break in either direction.
- Confirmation: Traders watch for a breakout above resistance (bullish) or below support (bearish) before making a move.
6. Flags and Pennants:
These are short-term continuation patterns that indicate a pause in the trend before it resumes.
- Flag Pattern: A sharp price movement (called the flagpole) followed by a small rectangular consolidation period (the flag) before continuing in the same direction.
- Pennant Pattern: Similar to a flag but with a triangular consolidation phase.
- Confirmation: Traders enter positions when the price breaks out of the flag or pennant.
7. Cup and Handle:
The Cup and Handle is a bullish continuation pattern that suggests the price may rise further.
- Formation: The price forms a rounded bottom (cup) followed by a smaller downward movement (handle) before breaking out.
- Meaning: This pattern signals accumulation, meaning buyers are gradually gaining strength before pushing prices higher.
- Confirmation: The price should break above the resistance level of the handle to confirm an upward trend.
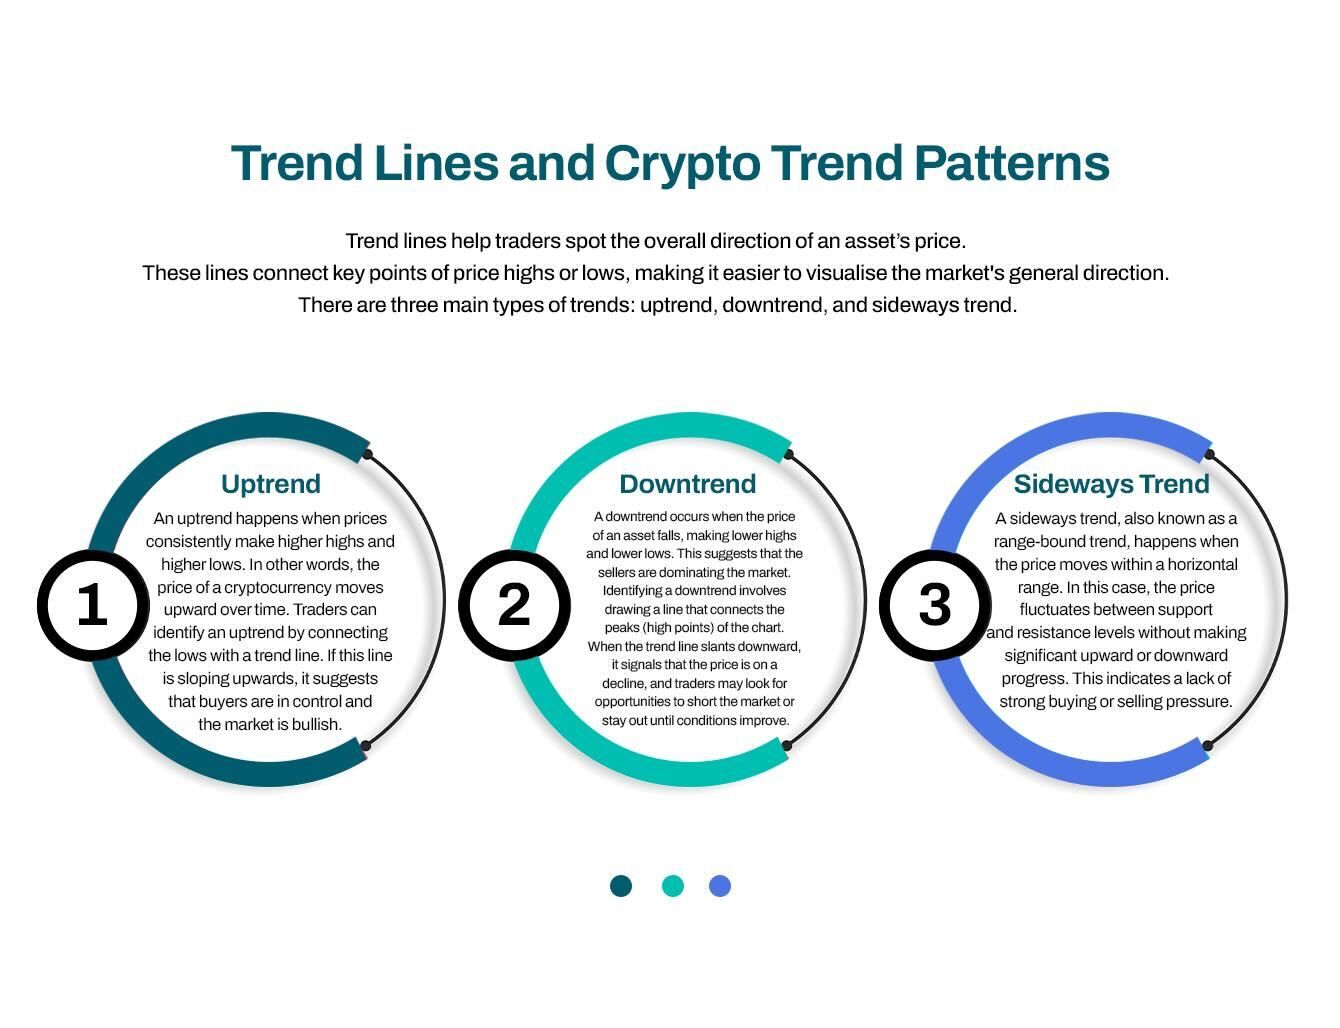
Trend Lines and Crypto Trend Patterns
Trend lines help traders spot the overall direction of an asset’s price.
These lines connect key points of price highs or lows, making it easier to visualise the market's general direction. There are three main types of trends: uptrend, downtrend, and sideways trend.
1. Uptrend:
An uptrend happens when prices consistently make higher highs and higher lows. In other words, the price of a cryptocurrency moves upward over time.
Traders can identify an uptrend by connecting the lows with a trend line. If this line is sloping upwards, it suggests that buyers are in control and the market is bullish.
2. Downtrend:
A downtrend occurs when the price of an asset falls, making lower highs and lower lows. This suggests that the sellers are dominating the market.
Identifying a downtrend involves drawing a line that connects the peaks (high points) of the chart. When the trend line slants downward, it signals that the price is on a decline, and traders may look for opportunities to short the market or stay out until conditions improve.
3. Sideways Trend:
A sideways trend, also known as a range-bound trend, happens when the price moves within a horizontal range.
In this case, the price fluctuates between support and resistance levels without making significant upward or downward progress. This indicates a lack of strong buying or selling pressure.
Technical Indicators for Crypto Graph Analysis
Technical indicators are essential tools that crypto traders use to understand market trends and make better trading decisions.
These indicators help confirm price movements and trends, providing a clearer picture of where the market is heading.
By using technical indicators, traders can better interpret cryptocurrency graph analysis and predict potential price changes.
Let’s explore some of the most widely used indicators:
1. Moving Averages:
A Moving Average (MA) is one of the most common tools for smoothing out price action over a specific period.
It helps to identify the general direction of a trend, whether it's upward, downward, or sideways.
The most frequently used moving averages are the Simple Moving Average (SMA) and the Exponential Moving Average (EMA).
Both provide different weighting to past prices, with the EMA giving more importance to recent data.
Traders often use moving averages to spot trend reversals or identify support and resistance levels.
2. Relative Strength Index (RSI):
The Relative Strength Index (RSI) is an important indicator used to measure market momentum.
It ranges from 0 to 100 and helps determine whether a cryptocurrency is overbought or oversold.
If the RSI is above 70, the market may be overbought, suggesting that the price might fall soon. On the other hand, if the RSI is below 30, the market might be oversold, indicating a potential price increase.
This indicator helps traders understand when it might be a good time to buy or sell based on market momentum.
3. Moving Average Convergence Divergence (MACD):
The MACD is another powerful indicator that helps determine trend strength and direction.
It consists of two moving averages – the MACD line and the Signal line – as well as a histogram that shows the difference between the two.
When the MACD line crosses above the Signal line, it indicates a potential buy signal, while a crossover below the Signal line suggests a sell signal.
The MACD is particularly useful for identifying changes in trend direction and can help traders predict short-term price movements.
4. Bollinger Bands:
Bollinger Bands are used to measure market volatility and identify potential overbought or oversold conditions.
The bands consist of a middle line, which is typically a 20-period moving average, and two outer bands that are set two standard deviations away from the middle line.
When the price moves closer to the upper band, the market might be overbought, while a price near the lower band could signal an oversold market.
Bollinger Bands also help identify periods of high or low volatility, which are crucial for understanding price fluctuations in the cryptocurrency market.
5. Fibonacci Retracement:
Fibonacci Retracement is based on the famous Fibonacci sequence, and it is used to identify potential support and resistance levels during a price pullback.
The key Fibonacci levels include 38.2%, 50%, and 61.8%. These levels are drawn on a cryptocurrency chart by taking the high and low points of a price movement and plotting horizontal lines at these levels.
Traders use these levels to predict where the price might reverse or find support, making it an essential tool for managing risk in crypto trading.
To Recap
- Crypto charts are tools used to track cryptocurrency price movements over time, showing details like prices, trading volume, and market trends.
- Line charts offer a simple overview of price trends, connecting closing prices with a continuous line, and are suitable for beginners.
- Bar charts provide more detailed data, including opening, highest, lowest, and closing prices (OHLC data), and help spot trends and reversals.
- Candlestick charts display OHLC data visually, with coloured candles indicating price increases (green/white) or decreases (red/black), and are popular for spotting patterns like bullish or bearish trends.
- Timeframes in crypto charts range from one minute to one month, with short-term traders using smaller timeframes and long-term investors using larger ones.
- Price movements on crypto charts show how a cryptocurrency’s value fluctuates over time, with candlesticks indicating increases or decreases in value.
- Volume represents the number of trades within a period and helps confirm the strength of price movements.
- Support levels indicate price points where an asset tends to stop falling, and resistance levels represent price points where it struggles to rise.
- Trend lines help visualise the market’s direction, identifying bullish, bearish, or consolidation patterns.
- Candlestick patterns, such as Hammer, Bullish Engulfing, and Doji, are used to predict price movements and market trends.
- Moving Averages (SMA and EMA) help identify trends, with crossovers signalling potential buying or selling opportunities.
- RSI is a momentum indicator that shows whether a cryptocurrency is overbought (above 70) or oversold (below 30), guiding trading decisions.
- Common candlestick patterns include Bullish (e.g., Hammer, Morning Star) and Bearish (e.g., Shooting Star, Evening Star) patterns that signal potential market reversals.
- Practical tips for reading them include checking volume for pattern reliability, using appropriate timeframes for specific strategies, confirming patterns with other indicators, and practising on live charts.
- Common chart patterns like Head and Shoulders, Wedges, and Double Top/Bottom signal trend reversals, with confirmation required before acting.
- Support and Resistance levels are key in determining when to buy or sell, with support being a buying point and resistance a selling point.
FAQs
Q1. What is cryptocurrency graph analysis?
Cryptocurrency graph analysis involves studying price movements on trading charts to predict future trends.
Q2. How to read crypto charts for beginners?
Start with line charts, understand support and resistance levels, and gradually move to candlestick patterns.
Q3. What are crypto trading charts used for?
Crypto trading charts help traders analyse past price trends and make informed trading decisions.
Q4. How do I identify patterns in crypto charts?
Look for common patterns like head and shoulders, wedges, and candlestick formations.
Q5. Why are candlestick patterns important?
Candlestick patterns help traders identify potential price reversals and trends.
Q6. What is the best way to read crypto charts?
Combine trend analysis, technical indicators, and volume analysis.
Q7. How can I learn to read crypto charts effectively?
Practice using live cryptocurrency chart tools and study historical price movements.
Q8. What are support and resistance levels?
Support is a price level where demand prevents further decline, while resistance is where selling pressure prevents further increase.
Q9. What is the role of moving averages in crypto graph analysis?
Moving averages help smooth out price fluctuations and identify trends.
Q10. Why is chart analysis in crypto important?
Chart analysis helps traders make informed decisions and minimise risks in cryptocurrency trading.
Disclaimer: This article was written to provide guidance and understanding. It is not an exhaustive article and should not be taken as financial advice. Obiex will not be held liable for your investment decisions.